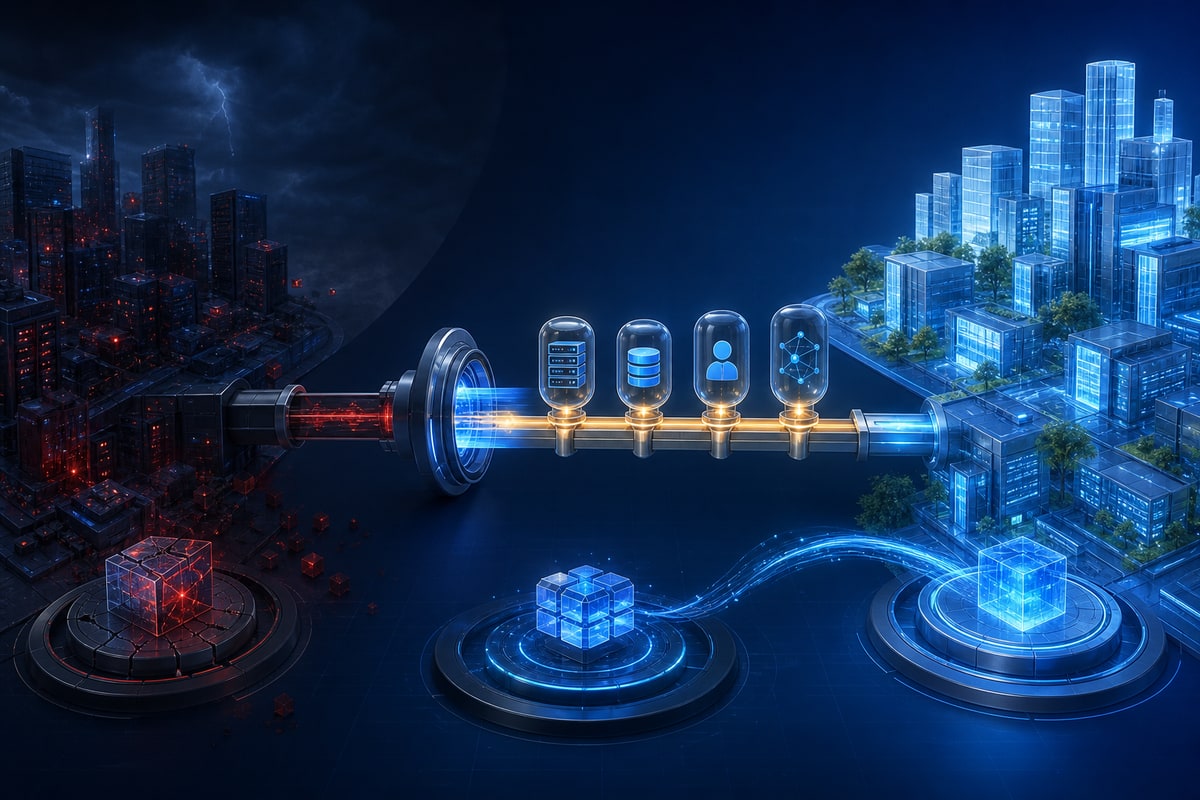
Monitoring tracks known conditions; observability helps teams investigate the system's internal state from its outputs, including failures they did not predict. They are complementary capabilities—not competing products.
Monitoring Answers Known Questions
Monitoring collects signals and evaluates expected conditions: CPU is above a threshold, a queue is growing, checkout success has fallen, or a certificate will expire.
Good monitoring supports a defined decision. It tells an owner when intervention is justified and includes enough context to begin. A wall of green and red charts is not an operating model.
Observability Supports Investigation
Distributed systems fail through interactions between services, users, versions, data, networks, and external dependencies. Observability lets engineers explore those dimensions without deploying new instrumentation for every question.
The foundation usually includes:
- metrics for trends and aggregated behaviour;
- logs for discrete events and diagnostic context;
- traces for a request's path across components;
- profiles where code-level resource use matters;
- deployment and business events to explain change.
Correlation is crucial. A trace identifier shared across logs and services can reduce a long manual search to one connected journey.
Start from Outcomes
Instrument critical user journeys before collecting everything. Track request success, latency, throughput, freshness, correctness, and saturation according to the service.
Then capture the context needed to explain degradation: route, tenant, region, version, dependency, and controlled error classification. Never add sensitive personal data merely because it might help debugging.
Prevent Telemetry from Becoming Noise
High-cardinality attributes, duplicated logs, and unbounded retention can make observability expensive. Define a telemetry budget and retention tiers. Sample high-volume successful traces while retaining errors and rare cases with appropriate rules.
Standardise naming and semantic conventions. Otherwise, every team describes the same concept differently and cross-service investigation breaks.
Design Alerts for Action
Alert on user impact, SLO burn, and conditions requiring timely response. Route every alert to an accountable team with severity, context, runbook, and escalation.
Move informational signals into dashboards or reports. Regularly review alerts that never produce action and incidents that produced no useful alert.
Build an Operating Practice
Instrumentation must evolve with software. Include telemetry in design reviews and delivery acceptance. During incidents, record which questions were difficult to answer; convert those gaps into backlog work.
Measure the capability through detection time, diagnosis time, alert quality, trace coverage of critical journeys, and the proportion of incidents with sufficient evidence—not by log volume.
DualByte's cloud infrastructure service can implement an OpenTelemetry-based foundation and dashboards aligned to real business journeys.
Sources
Need help with implementation?
Get a free consultation with the DualByte team for your business technology needs.